
“With 3% of the world’s resources and 25% of the world’s demand, it is pretty obvious this country cannot drill its way to energy security”
With the US Senate working towards a vote on the Keystone XL pipeline and President Obama’s January 6th press release indicating he would veto a Keystone bill if it reaches his desk, there is little chance you have not heard of the pipeline. The proposed Keystone XL is intended to deliver Canadian Tar Sands across the United States to port towns in the Golf of Mexico. As we’ve been watching the debate unfold over the last number of months we have been wondering what, exactly, is the carbon footprint that pipeline would be responsible for. We were shocked and think you might be as well.
What Are Tar Sands?
They are deposits of “extra-heavy” oil bitumen – a semisolid hydrocarbon. Tar sand bitumen is so dense that at 52 degrees Fahrenheit it is “as hard as a hockey puck” according to the Canadian Association of Petroleum Producers. So how does one get a hockey puck to travel through a pipe you may ask? By heating it to its melting point, or by diluting the bitumen creating a ‘synthetic crude’ with enough viscosity to ooze its way along.
Tar sands are known to be ‘dirtier’ than conventional crude oil. A study by the US Congressional Research Service titled Canadian Oil Sands: Life-Cycle Assessments of Greenhouse Gas Emissions explored the life-cycle greenhouse gas emissions associated with tar sands. The study points out that the extraction and refinement process is so intensive that emissions associated with its production (the embodied greenhouse gas of the product) are approximately twice that of conventional crude production. When you actually get the gas into your car, its emissions associated with powering your vehicle will be roughly the same as conventionally derived gasoline. When you factor together the Tar Sands production emissions with the operational emissions at the user end, the report finds that the total carbon footprint of Tar Sand derived gasoline is 117% that of conventional.
Some Facts and Figures About American Oil Pipelines
Oil is transported throughout the United States in four primary ways: truck, rail, boat, and pipeline. Currently there is a network of more than 190,000 miles of liquid petroleum pipelines, nearly 320,000 miles of gas transmission pipelines, and more than 2.4 million miles of gas distribution pipelines on or under American soil. (Pipeline101)
When viewed from the perspective of environmental safety, transportation of crude oil via pipeline is second least safe of the big four options. Between 2002 and 2007 alone, there were 110 million barrels of crude oil spilled from American pipelines, over 3 times that of that from rail transport. Over the period 1996-2007, truck and pipeline transport consistently spill more crude oil per ton-mile than rail or boat transport.
The existing network of Petroleum and Natural Gas pipelines throughout the US. Click to enlarge Source: EIA
Spill history of oil transportation modes. Click to enlarge

Transporting crude oil by pipeline is 3 times more environmentally damaging than by rail.
To Pipe or Not to Pipe
Some say that the development of Tar Sands will happen with or without the Keystone XL being constructed. A little reflection on the basic economic mechanism of crude oil development brings that into question. The driver behind wanting to construct the Keystone XL pipeline – or any pipeline for that matter, is to reduce the cost of transport and therefore development of the Tar Sands crude oil.
In comparison to conventional crude oil, Tar Sands oil is very expensive to develop. The costs to develop crude oil become a critical factor in determining whether or not that resource is exploited. As crude oil inched up towards $100 a barrel, the Tar Sands became financially viable. With the current global ‘price war’ on crude oil responsible for dropping crude to $50 a barrel and gas prices at the pump to $2 a gallon or less, the financial viability of Tar Sands becomes questionable. Thus the need for the cheapest forms of transportation from the plains of Canada to the ocean ways of global trade.

Keystone XL would ooze along 1 Olympic sized pool of extra-heavy crude every 28 minutes.
Keystone's Carbon Footprint
The pipeline section currently being considered is 1,172 miles long and will connect with existing pipelines to finish a 2,000 mile journey to the Golf of Mexico. The proposed pipeline will carry 800,000 barrels of tar sands oil a day. That is 12,264,000,000 gallons annually – enough to fill 18,582 Olympic pools annually. That is one pool oozing out the end of it every 28 minutes. Around the clock.
Looking to data available through the EPA , every barrel of conventional crude oil produces 0.43 metric tons of CO2. As noted in the Congressional Research report, that equates to 0.5031 metric tons for Tar Sands crude. At that pace, the Keystone XL will be responsible for a total of 146,905,200 metric tons of CO2 emissions annually. That is a volume of atmospheric greenhouse gas equal to 2.8 trillion cubic feet. Greenhouse gas that will remain in the atmosphere for at least 100 years.
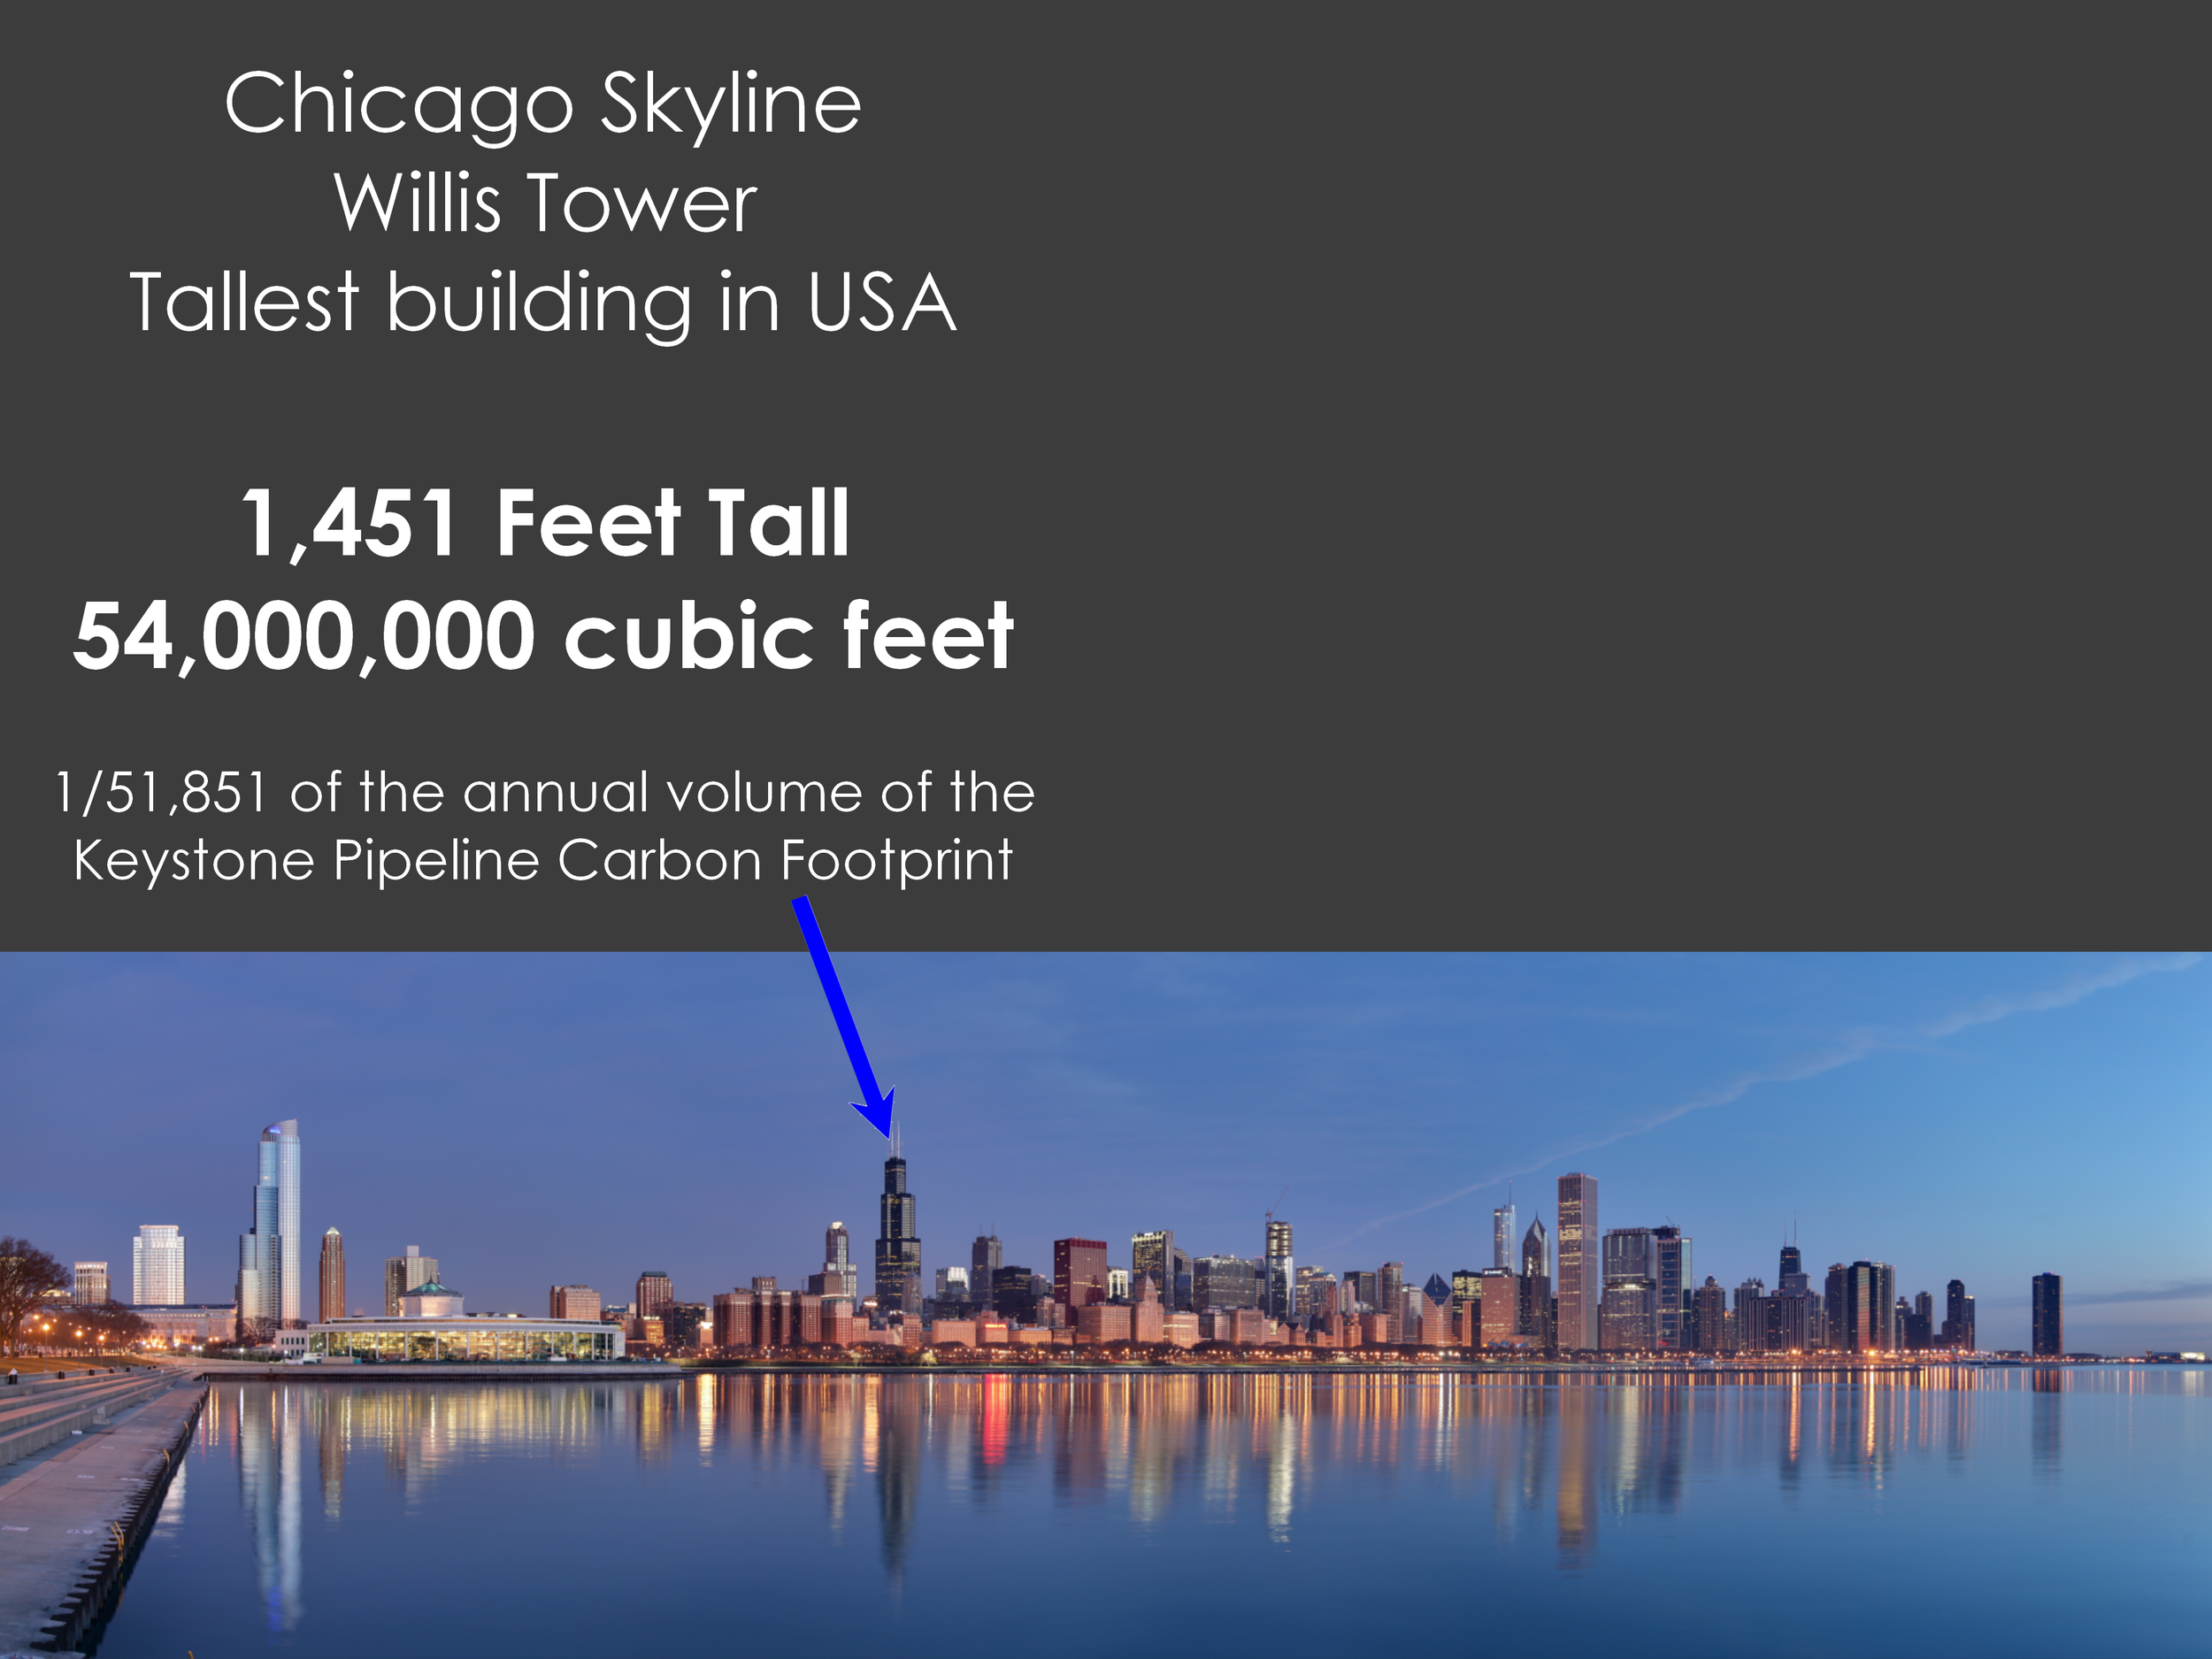
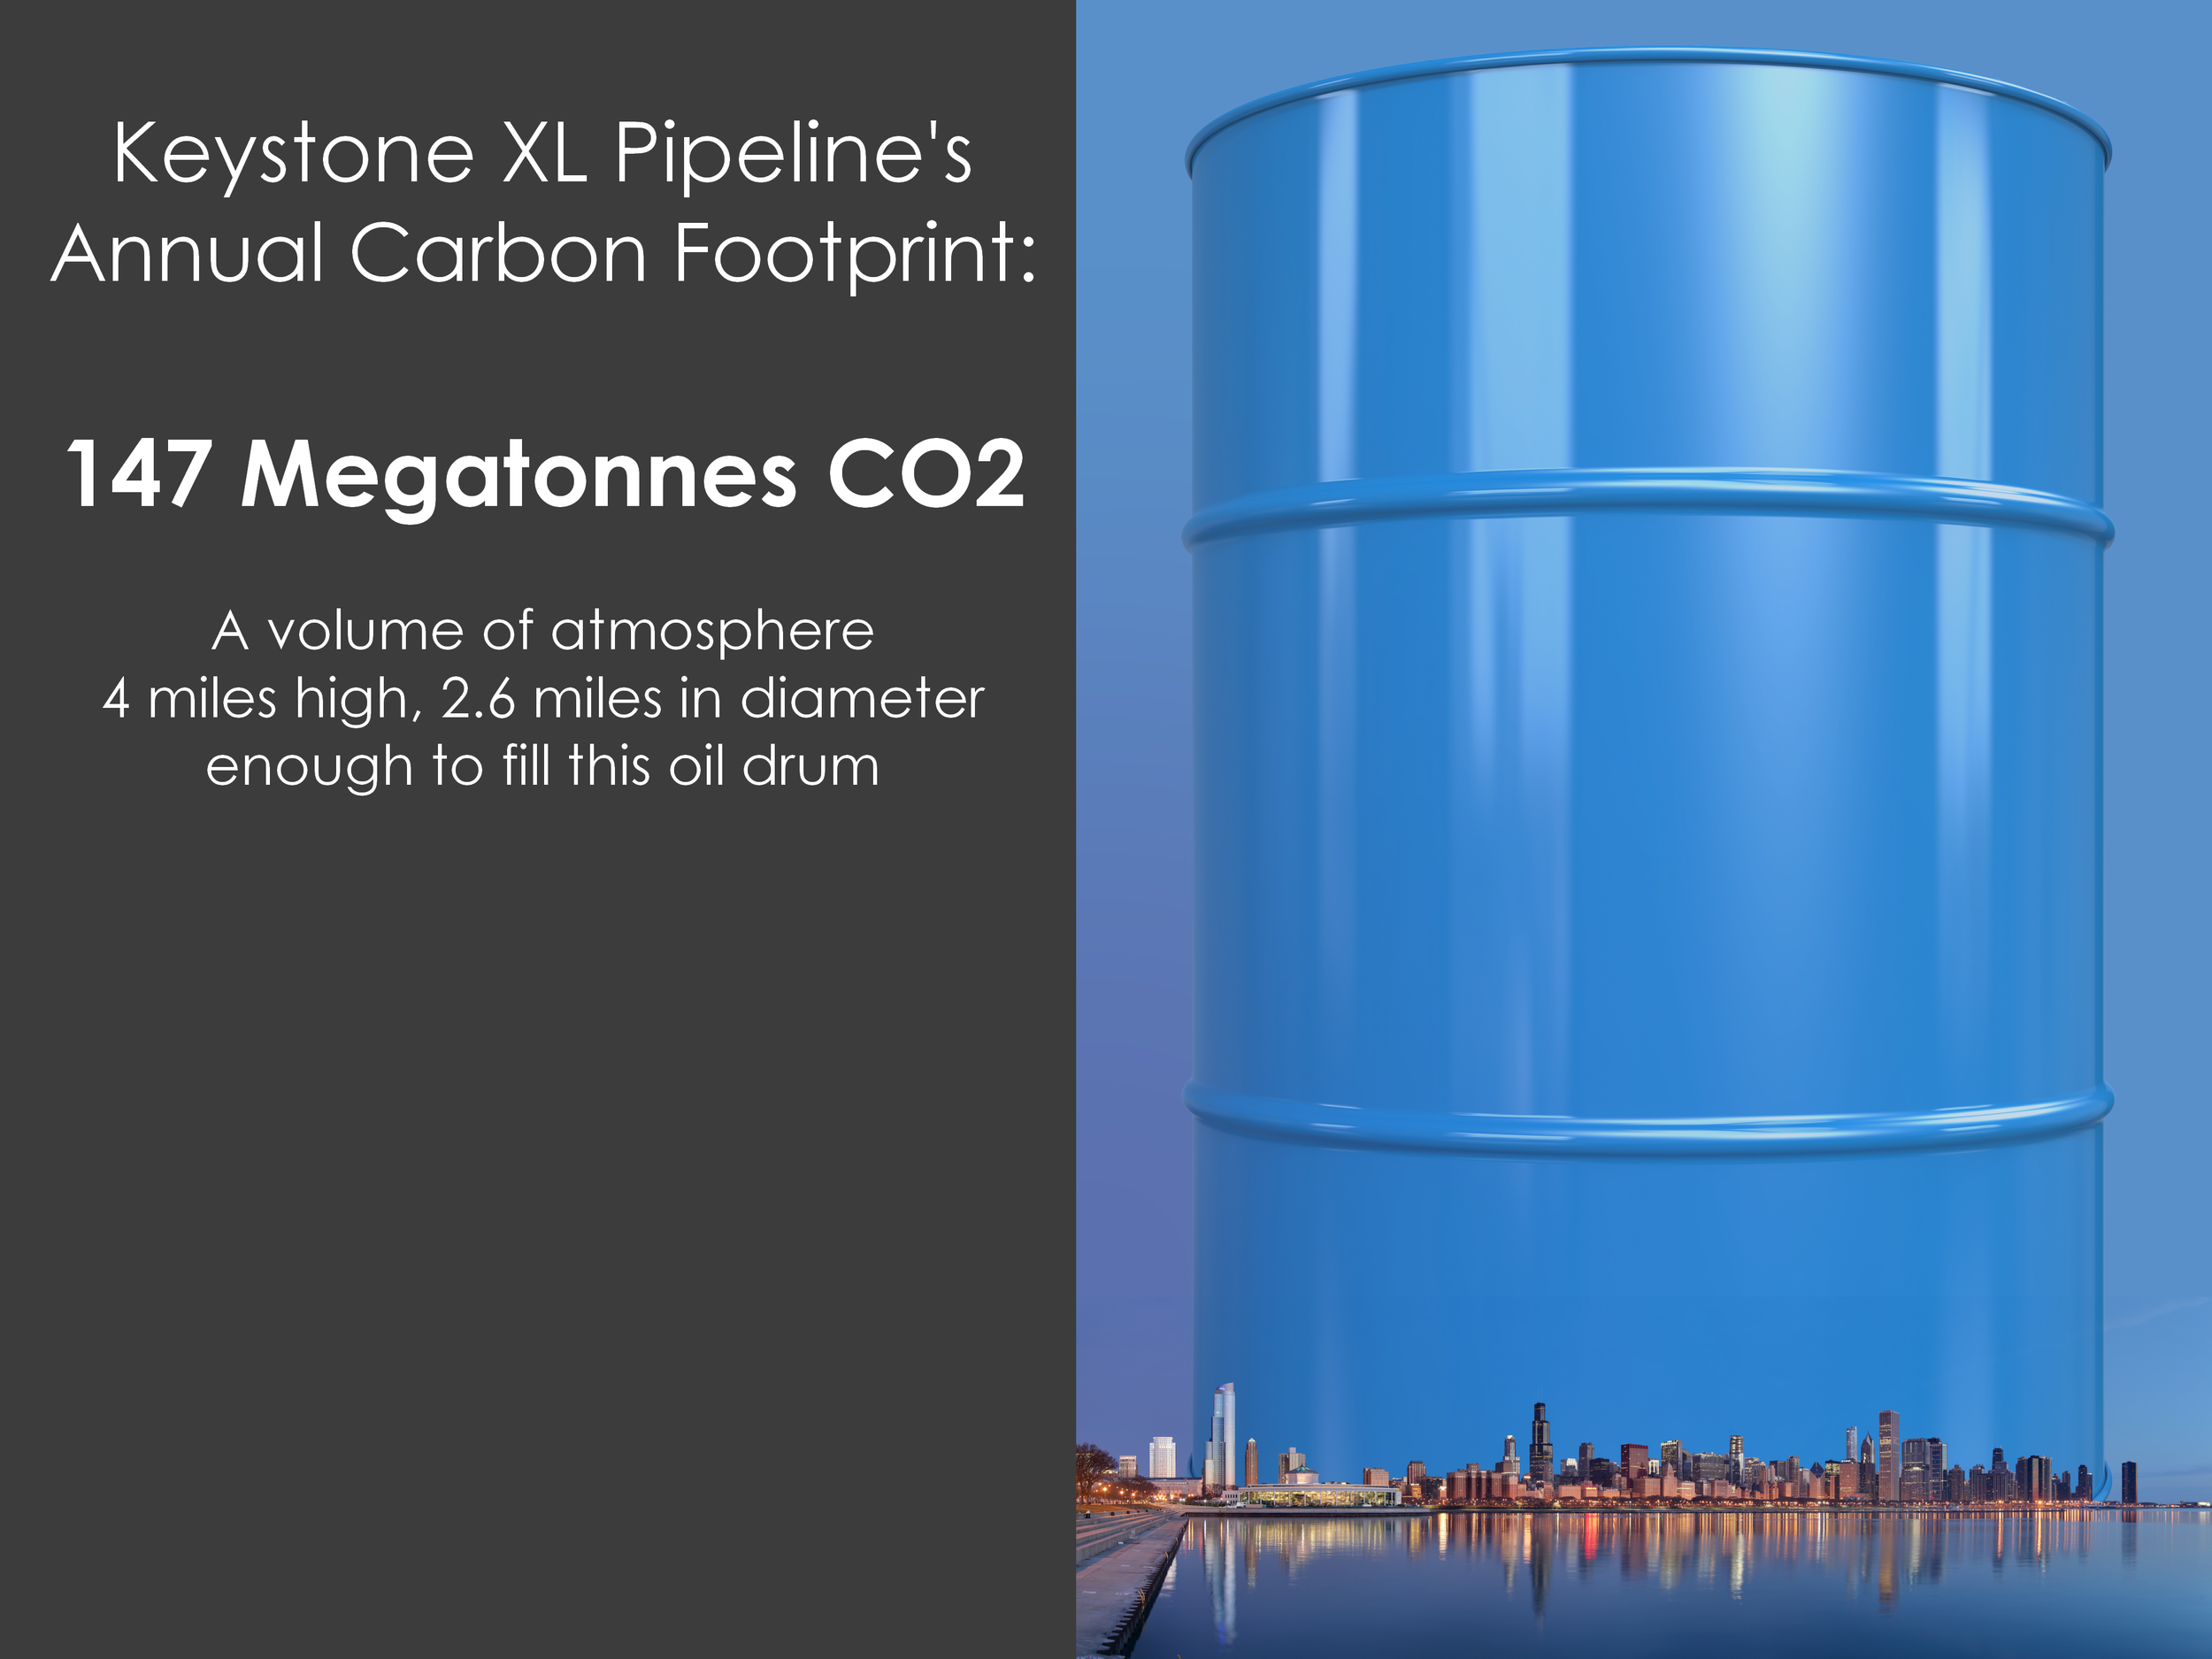
That sort of number is really tough to get your head wrapped around. It would fill an oil barrel nearly 4 miles high. It is a volume equivalent of 51,851 Willis Towers in Chicago. It would take nearly 41 volcanic eruptions to equal volume of greenhouse gas emissions coming from that single 36” diameter pipe.
What the Decision is Really About
Some have stated that the development of the Keystone XL is about American ‘energy security’. It is not. It is about delivering Canadian tar sands to the global oil market. A simple way to prove that statement is to find an answer to the simple question: why would a Canadian company wishing to deliver crude oil to refineries serving the US market choose to pipe extra-heavy crude oil 2,000 miles to the Golf of Mexico when Northern States have an existing refining capacity of nearly 4 million barrels a day?
Refinery Capacity throughout US. Click to enlarge
A quick reference to a map of refinery locations show numerous refineries just South of the Canadian border in Montana, North Dakota, and Minnesota, not to mention Wyoming, Iowa, and Wisconsin. The total refinery capacity just south of the border is 5 times the volume to be carried by the proposed Keystone. Clearly, the pipeline is not about US energy security, it is about transporting a particularly toxic and carbon ‘dirty’ crude oil to port locations for access to the international market.
We suggest we consider this decision in terms of what future we wish to create for the United States. Do we wish to continue to invest in the short-term economics of the exhaustion of a finite resource past its peak, or do we invest in creating infrastructure enabling the United States to meet its energy needs with the sun, wind, and water power that falls freely within our boundaries? That is a vision of a truly energy secure nation.
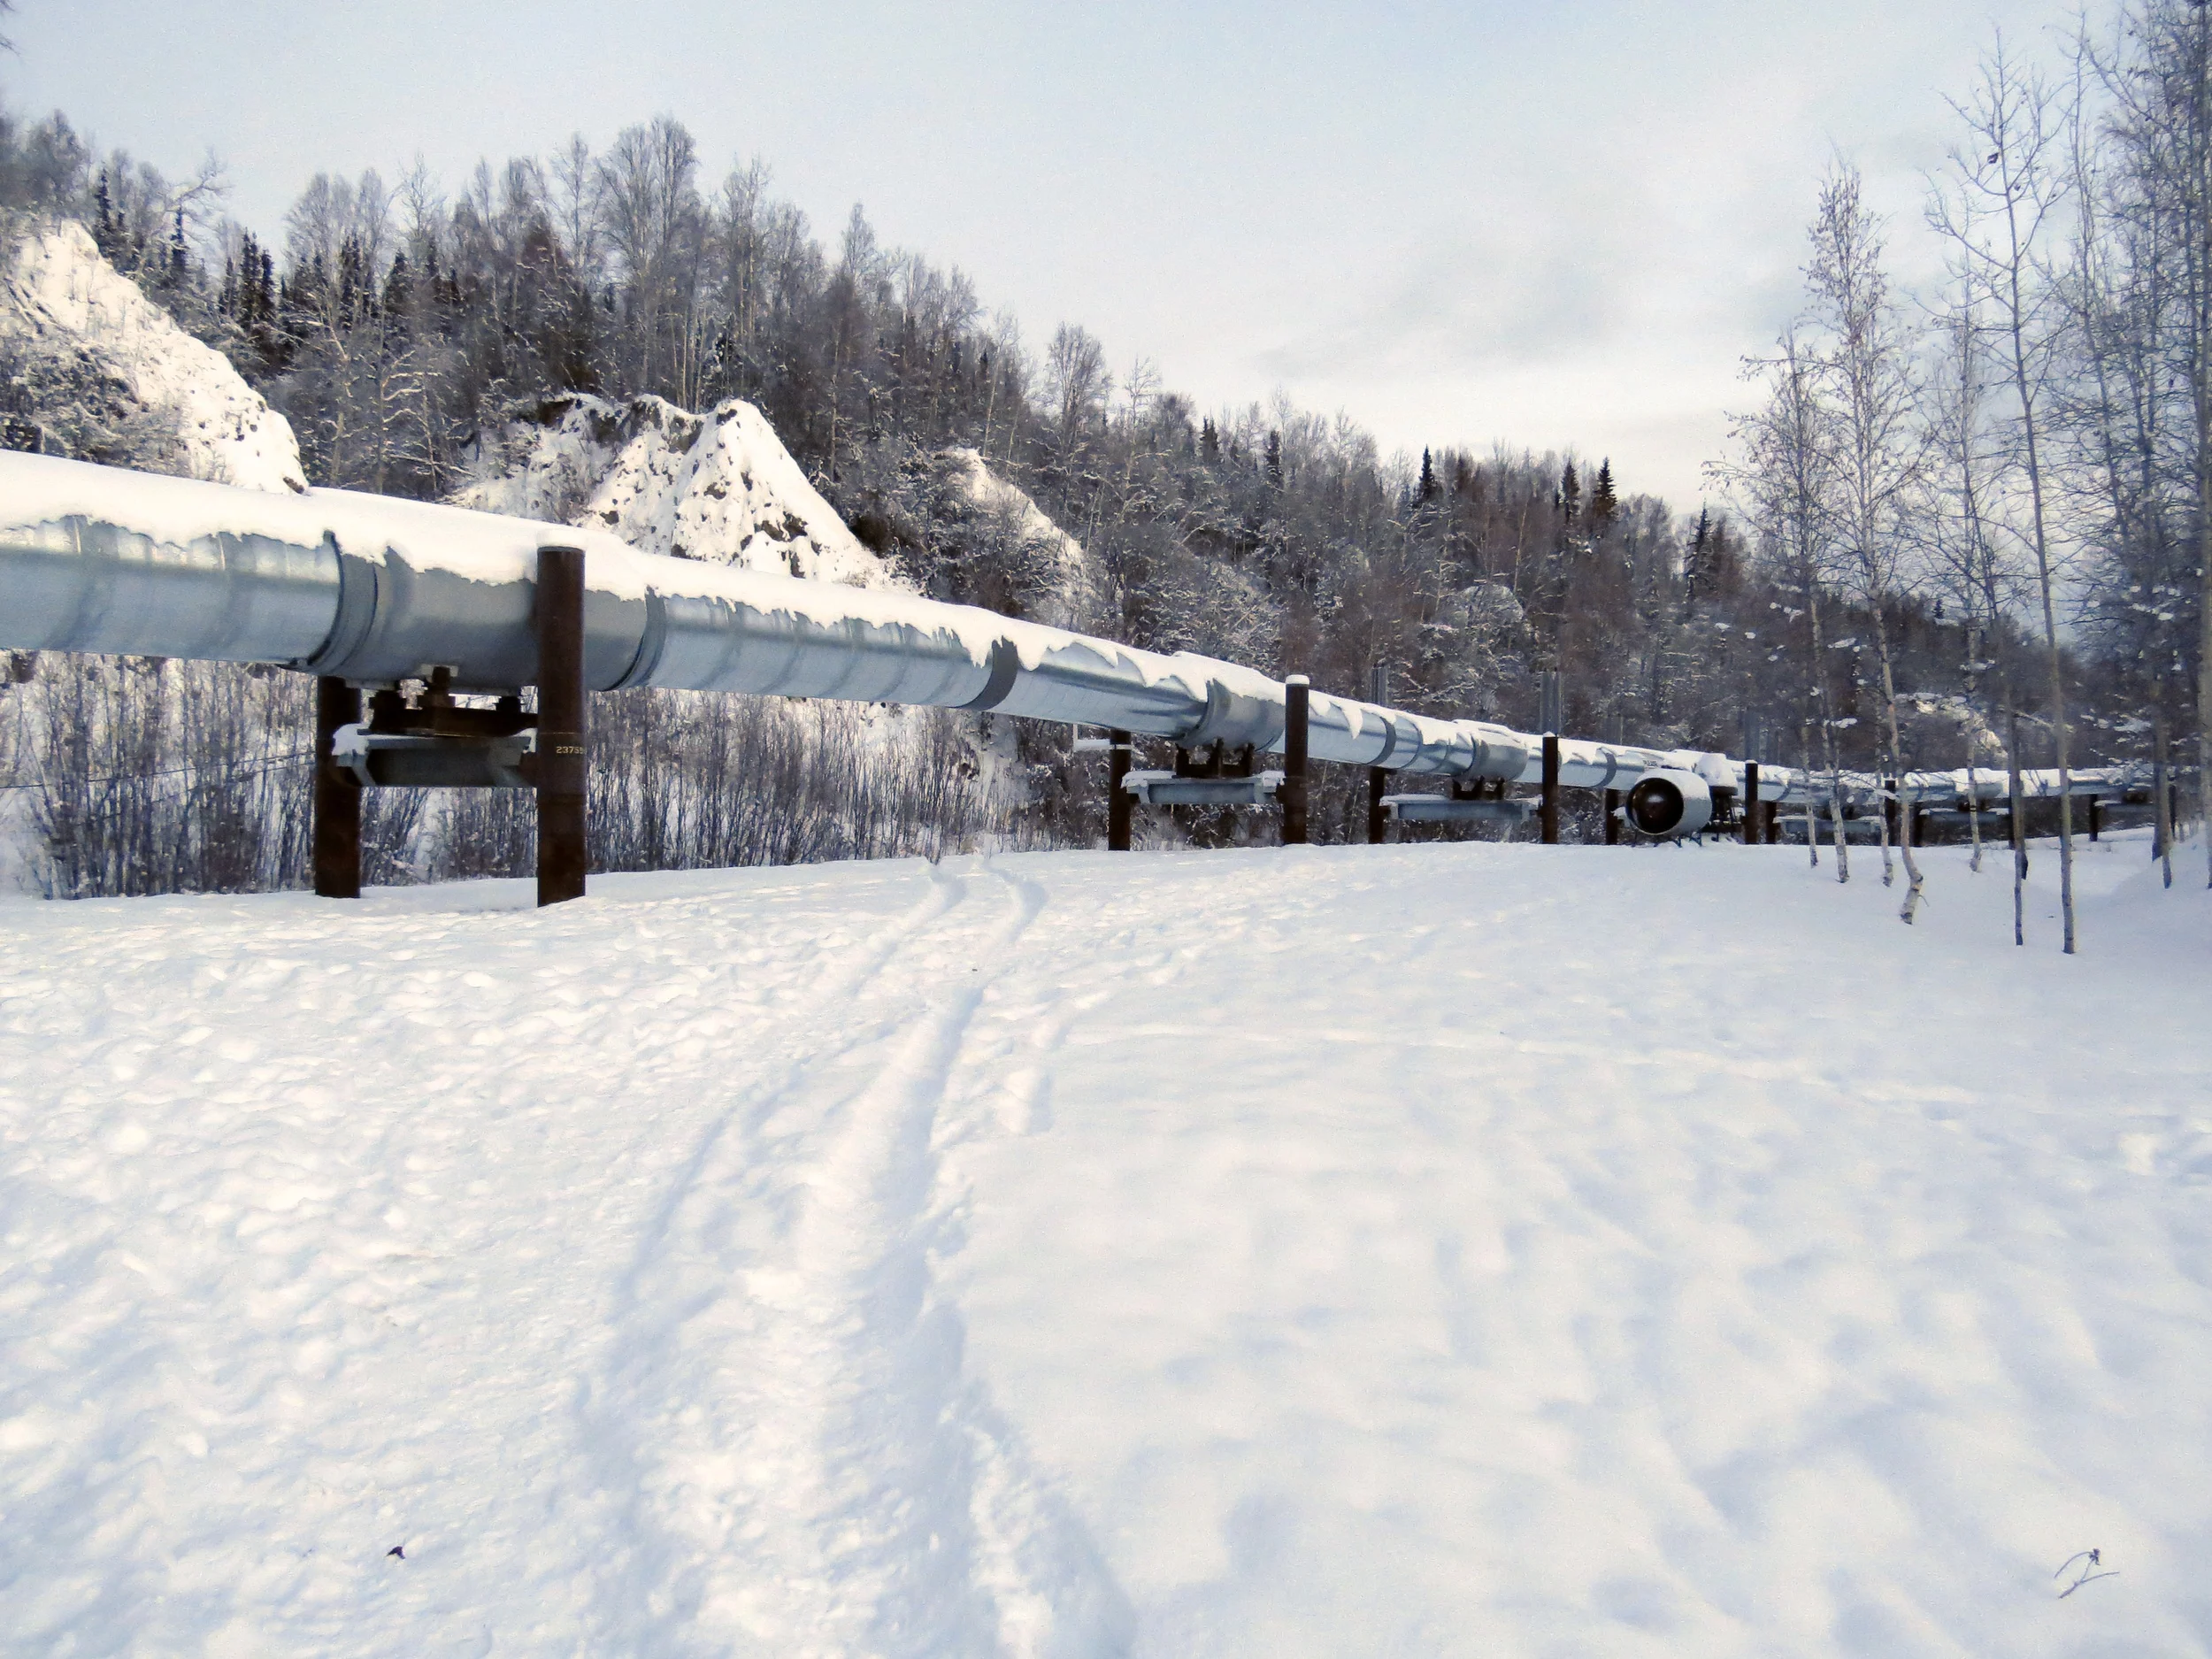
Photos: Pipeline by Malcolm Manners via Flickr; Chicago by Daniel Schwen via Flickr